My environment: VS 2005, MS Office 2003.
- Adding the reference. Right click on your web project -> select add a reference -> select "COM" tab -> find and add the "Microsoft Office Web Component 11".
PS: The OWC version is depending on the version of MS Office you are using. I am using Office 2003 so the OWC version will be 11. - In your code-behind file, add this
using Microsoft.Office.Interop.Owc11;
- Prepare your data source. Here I create a sample data for this demo:
string CategoryData = "01:00, 02:00, 03:00, 04:00, 05:00, 06:00, 0700, 0800, 0900, 10:00, 11:00, 12:00";
string ValueData = "2.6, 2.5, 2.4, 2.3, 2.4, 2.5, 2.3, 2.6, 2.8, 3.3, 3.8, 4.2";
- Adding this method
private void DrawChart(string CategoryData, string ValueData)
{
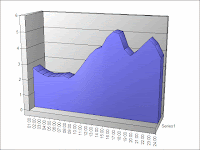
ChartSpaceClass oChartSpace = new ChartSpaceClass();
ChChart oChart = oChartSpace.Charts.Add(0);

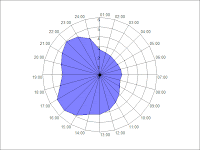
//Here is the place to set the chart type. I use the Line chart here.
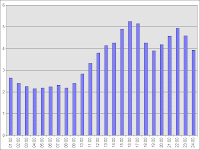
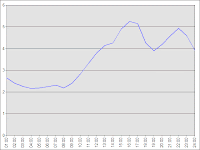
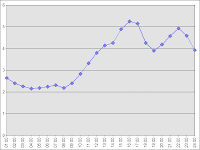
oChart.Type = ChartChartTypeEnum.chChartTypeLine;
oChart.Axes[0].HasMajorGridlines = true;
oChart.Axes[1].HasTitle = true;
oChart.Axes[1].Title.Caption = "MWH";
oChart.HasTitle = true;
oChart.Title.Caption = "Hourly Data";

oChart.SeriesCollection.Add(0);
//CategoryData is the X axes value
oChart.SeriesCollection[0].SetData(ChartDimensionsEnum.chDimCategories, Convert.ToInt32(ChartSpecialDataSourcesEnum.chDataLiteral), CategoryData);
//ValueData is the Y axes value
oChart.SeriesCollection[0].SetData(ChartDimensionsEnum.chDimValues, Convert.ToInt32(ChartSpecialDataSourcesEnum.chDataLiteral), ValueData);

//Export to an image and assign it to the image control. You can change the width and height.
oChartSpace.ExportPicture(Server.MapPath("~/Common/DPChart.gif"), "GIF", 640, 480);
//this makes sure you can always get the new image
Image1.Attributes.Add("src", "Common/DPChart.gif?ts=" + DateTime.Now.ToBinary());

oChart = null;
oChartSpace = null;
dt.Dispose();
}



You can find the more professional .Net chart component called "ZedGraph". It's FREE, and it comes with source code.
Update:
You must register OWC on the Server in order to use it. If you are using the same version as I am, then go here to download and install it.
Nice post...
ReplyDelete